![]() The difference in degradation
behavior of titania-doped tin dioxide films is explained by a pronounced effect
of the doping level on the film dispersity and fine distribution of titania.
Two ñ three times decrease of nanoparticles size in doped films compared to
nanoparticles in SnO2 film (20 ñ 30 nm) is revealed by using
scanning tunneling microscopy (STM). STM data (measured in ex situ configuration) combined with XRD and Mössbauer
spectroscopy analysis confirm that nanoparticles are composed of nanostructured
heavily disordered SnO2 and TiO2 Ýrutile solid solution or of amorphous phase
containing both SnO2 and TiO2, the content of
the crystalline and amorphous phases being approximately equal.
The difference in degradation
behavior of titania-doped tin dioxide films is explained by a pronounced effect
of the doping level on the film dispersity and fine distribution of titania.
Two ñ three times decrease of nanoparticles size in doped films compared to
nanoparticles in SnO2 film (20 ñ 30 nm) is revealed by using
scanning tunneling microscopy (STM). STM data (measured in ex situ configuration) combined with XRD and Mössbauer
spectroscopy analysis confirm that nanoparticles are composed of nanostructured
heavily disordered SnO2 and TiO2 Ýrutile solid solution or of amorphous phase
containing both SnO2 and TiO2, the content of
the crystalline and amorphous phases being approximately equal.
![]() Keywords: Tin dioxide, lithium intercalation,
scanning tunneling microscopy and spectroscopy, nanostructure
Keywords: Tin dioxide, lithium intercalation,
scanning tunneling microscopy and spectroscopy, nanostructure
![]() Nanostructured SnO2-based
compositions well-known as materials for gas sensors [1, 2] were recently found
to be also prospective candidates for lithium batteries [3-5]. The initial cathodic
polarization of doped tin oxides in solutions of lithium salts results in the
irreversible reduction of oxide with formation of metallic tin. Thus formed
metallic tin dispersed in oxide matrix demonstrates the reversible
absorption-desorption of lithium with formation of intermetallic compound Li4.4Sn.
Correspondingly, irreversible (observed in the course of initial charging) and
reversible contributions to capacity can be separated. The size of initial
oxide particles is responsible for the values of capacity components and
stability of lithium recharging (see, for example, in Ref. [4]). A serious
problem results from the gradual increase of the size of metal particles,
which, in turn, induces the decrease of reversible capacity in respect to
lithium.
Nanostructured SnO2-based
compositions well-known as materials for gas sensors [1, 2] were recently found
to be also prospective candidates for lithium batteries [3-5]. The initial cathodic
polarization of doped tin oxides in solutions of lithium salts results in the
irreversible reduction of oxide with formation of metallic tin. Thus formed
metallic tin dispersed in oxide matrix demonstrates the reversible
absorption-desorption of lithium with formation of intermetallic compound Li4.4Sn.
Correspondingly, irreversible (observed in the course of initial charging) and
reversible contributions to capacity can be separated. The size of initial
oxide particles is responsible for the values of capacity components and
stability of lithium recharging (see, for example, in Ref. [4]). A serious
problem results from the gradual increase of the size of metal particles,
which, in turn, induces the decrease of reversible capacity in respect to
lithium.
![]() An alternative
concept of lithium intercalation by tin oxides stresses the role of Sn-O-Li
nanoscalephases, not intermetallic compounds. The stability of nanoscale phases
in relation to reduction by lithium determines more slow growth of tin
crystallities [6]. When some foreign oxides (like B2O3,
Al2O3 or P2O5) are inserted to form
dispersed amorphous tin-based composite oxide, the best long-term cycling is
achieved resulting from high stability in respect to reduction [7].
An alternative
concept of lithium intercalation by tin oxides stresses the role of Sn-O-Li
nanoscalephases, not intermetallic compounds. The stability of nanoscale phases
in relation to reduction by lithium determines more slow growth of tin
crystallities [6]. When some foreign oxides (like B2O3,
Al2O3 or P2O5) are inserted to form
dispersed amorphous tin-based composite oxide, the best long-term cycling is
achieved resulting from high stability in respect to reduction [7].
![]() Nanoheterogeneous titania-doped tin
oxide films prepared by thermohydrolytic decomposition of SnCl2 and
TiCl4 solutions can be considered as prospective charge-accumulating
materials because of high conductivity, nanometer-scale size of constituents,
and mechanical stability in the course of prolonged cycling in aqueous
solutions [1, 2]. For lithium accumulation by the films of this type [8, 9],
the reversible capacity up to 650 mA h g-1 is found, with
satisfactory cycling stability.
Nanoheterogeneous titania-doped tin
oxide films prepared by thermohydrolytic decomposition of SnCl2 and
TiCl4 solutions can be considered as prospective charge-accumulating
materials because of high conductivity, nanometer-scale size of constituents,
and mechanical stability in the course of prolonged cycling in aqueous
solutions [1, 2]. For lithium accumulation by the films of this type [8, 9],
the reversible capacity up to 650 mA h g-1 is found, with
satisfactory cycling stability.
![]() Structural studies of multicomponent oxide film
electrodes (electrocatalysts, etc) prepared by the above mentioned technique
show that the reaction of hydrated species in solution followed by heat
treatment results in the formation of unusual nonequilibrium phases ñ
nanoheterogeneous solid solutions [10,11]. They have been found to be a mixture
of various oxide nanoclusters (RuO2, TiO2, IrO2,
SnO2) of less than 1-2 nm size, which are statistically distributed
in amorphous matrix formed by their hydrated precursors.
Structural studies of multicomponent oxide film
electrodes (electrocatalysts, etc) prepared by the above mentioned technique
show that the reaction of hydrated species in solution followed by heat
treatment results in the formation of unusual nonequilibrium phases ñ
nanoheterogeneous solid solutions [10,11]. They have been found to be a mixture
of various oxide nanoclusters (RuO2, TiO2, IrO2,
SnO2) of less than 1-2 nm size, which are statistically distributed
in amorphous matrix formed by their hydrated precursors.
![]() According to STM, XRD and XPS
studies, SnO2 films containing 10 mol % TiO2 (ST10),
annealed at 450°C
consist of globules of 15 ñ 20 nm size, which in turn have a fine nanostructure
[1, 2, 11]. The cores
of globules contain crystallites of (Sn, Ti)O2 rutile solid
solution (6ñ8 nm) pierced with amorphous SnO2 strips. The similar
amorphous SnO2 layers containing up to 15% SnO cover the globule
surface. Such nanostructure in ST10 films is due to the formation of the
crystalline SnCl2 intercalation phase as their precursor, which contains
inclusions of polynuclear titanium-tin oxohydroxo complexes.
According to STM, XRD and XPS
studies, SnO2 films containing 10 mol % TiO2 (ST10),
annealed at 450°C
consist of globules of 15 ñ 20 nm size, which in turn have a fine nanostructure
[1, 2, 11]. The cores
of globules contain crystallites of (Sn, Ti)O2 rutile solid
solution (6ñ8 nm) pierced with amorphous SnO2 strips. The similar
amorphous SnO2 layers containing up to 15% SnO cover the globule
surface. Such nanostructure in ST10 films is due to the formation of the
crystalline SnCl2 intercalation phase as their precursor, which contains
inclusions of polynuclear titanium-tin oxohydroxo complexes.
![]() Some two-three times larger titania-free
SnO2 globules were observed [11]. Hydrous tin oxide, which was
formed in the course of condensation of polynuclear species {SnOx(OH)6-x}n
has been found [11] to be the precursor of that phase. The latter species result
from hydrolysis of [Sn (IV)Cl4]L2 (L = OH, H2O)
complexes presenting in initial SnCl2 solution due to the partial
oxidation Sn(II) - > Sn(IV).
Some two-three times larger titania-free
SnO2 globules were observed [11]. Hydrous tin oxide, which was
formed in the course of condensation of polynuclear species {SnOx(OH)6-x}n
has been found [11] to be the precursor of that phase. The latter species result
from hydrolysis of [Sn (IV)Cl4]L2 (L = OH, H2O)
complexes presenting in initial SnCl2 solution due to the partial
oxidation Sn(II) - > Sn(IV).
![]() The role of TiO2 in creating
high charge storing properties of SnO2 remains unclear.
The role of TiO2 in creating
high charge storing properties of SnO2 remains unclear.
![]() The aim of this work was to obtain single
phase SnO2-based materials with a variable TiO2 content
and to study their structure, morphology, and electrochemical properties. At this stage the study is limited
to freshly prepared films, providing the basis for further understanding of
micro- and nanostructural changes induced by lithiation/delithiation. In this
study, we report as observed by using of STM, X-ray diffraction, and Mössbauer
spectroscopy.
The aim of this work was to obtain single
phase SnO2-based materials with a variable TiO2 content
and to study their structure, morphology, and electrochemical properties. At this stage the study is limited
to freshly prepared films, providing the basis for further understanding of
micro- and nanostructural changes induced by lithiation/delithiation. In this
study, we report as observed by using of STM, X-ray diffraction, and Mössbauer
spectroscopy.
![]() The condition of the synthesis of a new series
of SnO2 ñ TiO2 films (further designated as STx, where x = 0, 10, and 20 mol % TiO2 (Fabrication mode differed
from previously used in [1,2,8], so the sample denoted ST10 and ST20 are not
identical to the samples described in these Refs.)).
While the concentration of SnCl2 solution remained the same as in
[1,2,8] (0.067 M), the concentration of TiCl4 was increased by the
order of magnitude and amounted 1 M. It is known that in aqueous hydrochloric
acid solution of TiCl4 (cTi
= 0.01 ñ 0.05 mol/l and cHCl
= 0.1-2.0 mol/l) mono- and polynuclear forms of Ti (IV) hydroxyoxo complexes
exist for the latter [(TiO)8(OH)12]4+ species
predominate [12]. The rising of TiCl4 concentration (0.35 ñ 1.2
mol/l) (cHCl = 1
mol/l) resulted in the increase of the number of polynuclear complexes and the
degree of their polymerization. These polymeric species appear in essence the
nuclea of the hydrated titanium oxide [13]. The solutions were applied layer by
layer onto titanium supports pretreated by mechanical polishing and etching in
sulfuric acid. The temperature of annealing was 450oC for doped
films, 350oC and 450oC for pure tin oxide.
The condition of the synthesis of a new series
of SnO2 ñ TiO2 films (further designated as STx, where x = 0, 10, and 20 mol % TiO2 (Fabrication mode differed
from previously used in [1,2,8], so the sample denoted ST10 and ST20 are not
identical to the samples described in these Refs.)).
While the concentration of SnCl2 solution remained the same as in
[1,2,8] (0.067 M), the concentration of TiCl4 was increased by the
order of magnitude and amounted 1 M. It is known that in aqueous hydrochloric
acid solution of TiCl4 (cTi
= 0.01 ñ 0.05 mol/l and cHCl
= 0.1-2.0 mol/l) mono- and polynuclear forms of Ti (IV) hydroxyoxo complexes
exist for the latter [(TiO)8(OH)12]4+ species
predominate [12]. The rising of TiCl4 concentration (0.35 ñ 1.2
mol/l) (cHCl = 1
mol/l) resulted in the increase of the number of polynuclear complexes and the
degree of their polymerization. These polymeric species appear in essence the
nuclea of the hydrated titanium oxide [13]. The solutions were applied layer by
layer onto titanium supports pretreated by mechanical polishing and etching in
sulfuric acid. The temperature of annealing was 450oC for doped
films, 350oC and 450oC for pure tin oxide.
![]() X-ray dispersion analysis confirmed that the
content of SnO2 and TiO2 in films matched to the nominal
composition of Sn and Ti cations in original solution. Besides about 1% of
chlorine was found. XPES analysis showed that about 25 % of oxygen atoms
present in hydroxogroups, and 5% in aqua groups.
X-ray dispersion analysis confirmed that the
content of SnO2 and TiO2 in films matched to the nominal
composition of Sn and Ti cations in original solution. Besides about 1% of
chlorine was found. XPES analysis showed that about 25 % of oxygen atoms
present in hydroxogroups, and 5% in aqua groups.
![]() For electrochemical measurements, 1
M LiN(CF3SO2)2 in dioxolane was used as electrolyte
(water content below 70 ppm). Compartments of the three-electrode cell were
separated with porous membranes (polypropylene PORP). Potentials were measured
and are referred below vs. lithium reference electrode. Before starting the
experiments, oxide films were additionally dried under vacuum at 120oC
for 8 hours. EL-2 potentiostat designed in the Frumkin Institute, RAS, was
used.
For electrochemical measurements, 1
M LiN(CF3SO2)2 in dioxolane was used as electrolyte
(water content below 70 ppm). Compartments of the three-electrode cell were
separated with porous membranes (polypropylene PORP). Potentials were measured
and are referred below vs. lithium reference electrode. Before starting the
experiments, oxide films were additionally dried under vacuum at 120oC
for 8 hours. EL-2 potentiostat designed in the Frumkin Institute, RAS, was
used.
![]() For XRD, DRON-3M diffractometer run
by PC was used. For the decomposition of intensity profiles to multicomponent spectra
PROFITVZ program [14] was used. We could not perform quantitative analysis for
the electrodes studied since the lines of titanium support superimposed
practically all intensive rutile lines (besides 110) and prevented correct decomposition
of mixed maximums. The instrumental broadening b was too small (0.21 degree 2q) to make the corrections in FWHM (Full Width
at Half Maximum) value, therefore the latter was considered as b (diffraction broadening).
For XRD, DRON-3M diffractometer run
by PC was used. For the decomposition of intensity profiles to multicomponent spectra
PROFITVZ program [14] was used. We could not perform quantitative analysis for
the electrodes studied since the lines of titanium support superimposed
practically all intensive rutile lines (besides 110) and prevented correct decomposition
of mixed maximums. The instrumental broadening b was too small (0.21 degree 2q) to make the corrections in FWHM (Full Width
at Half Maximum) value, therefore the latter was considered as b (diffraction broadening).
![]() The samples
were studied with a conventional Mössbauer spectrometer. The
velocity drive of this spectrometer operates under the constant acceleration
mode over 1024 channels. The velocity scale of the Mössbauer spectra was
calibrated with a reference spectrum of metallic iron. All measurements were
carried out at room temperature. The Conversion Electron Mössbauer
Spectroscopy (CEMS) measurements were carried out using a gas detector with He + 5%CH4
as the flow-gas. In the (CEMS) method internal conversion electrons and Auger
electrons associated with the de-excitation of Mössbauer nuclei are
detected in the sample under study. Due to the small range of electrons in
solids this method is especially convenient for studying subsurface regions of
the order of a few hundreds atomic layers. 5 mCi CaSn119mO3
was used as g-ray
source in this experiment.
The samples
were studied with a conventional Mössbauer spectrometer. The
velocity drive of this spectrometer operates under the constant acceleration
mode over 1024 channels. The velocity scale of the Mössbauer spectra was
calibrated with a reference spectrum of metallic iron. All measurements were
carried out at room temperature. The Conversion Electron Mössbauer
Spectroscopy (CEMS) measurements were carried out using a gas detector with He + 5%CH4
as the flow-gas. In the (CEMS) method internal conversion electrons and Auger
electrons associated with the de-excitation of Mössbauer nuclei are
detected in the sample under study. Due to the small range of electrons in
solids this method is especially convenient for studying subsurface regions of
the order of a few hundreds atomic layers. 5 mCi CaSn119mO3
was used as g-ray
source in this experiment.
![]() For tunneling
microscopy experiments, homemade LitScan-2 device with extended spectroscopic
facilities was used. Pt-Ir tips (10% Ir) of 0.5 mm diameter were mechanically
sharpened. In topographic experiments, bias was 1.3 V (positively polarized
tip), and STM current was 0.3 nA. The technique of measuring the local spectra
is discussed in detail in [15]. Voltage-current spectra were measured under a
pulse mode, in order to avoid the shift of tip location in the course of
measurements. Voltage-distance spectra were registered under open feedback
loop, with the scan rates not exceeding 0.5 V s-1. Numerous
(100-150) repeated measurements of current-voltage and voltage-distance spectra
were carried out for all samples. These data were collected for various points
inside the area within the limits of piezomanipulator movement, and also for
various surface regions and experimental sets. Good reproducibility of the key
characteristic features of the tunneling spectra was found for each certain
type of oxide. Most typical spectra without any averaging or pretreatment are
presented in this article.
For tunneling
microscopy experiments, homemade LitScan-2 device with extended spectroscopic
facilities was used. Pt-Ir tips (10% Ir) of 0.5 mm diameter were mechanically
sharpened. In topographic experiments, bias was 1.3 V (positively polarized
tip), and STM current was 0.3 nA. The technique of measuring the local spectra
is discussed in detail in [15]. Voltage-current spectra were measured under a
pulse mode, in order to avoid the shift of tip location in the course of
measurements. Voltage-distance spectra were registered under open feedback
loop, with the scan rates not exceeding 0.5 V s-1. Numerous
(100-150) repeated measurements of current-voltage and voltage-distance spectra
were carried out for all samples. These data were collected for various points
inside the area within the limits of piezomanipulator movement, and also for
various surface regions and experimental sets. Good reproducibility of the key
characteristic features of the tunneling spectra was found for each certain
type of oxide. Most typical spectra without any averaging or pretreatment are
presented in this article.
![]() X-ray analysis revealed that the ST10 and ST20
films contained a single crystalline phase. The decomposition of the profile of
each reflection by program PROFITVZ evidenced that only one rutile phase gave
the contribution to the intensity profile. Maximums in the mixed films patterns
are very weak and diffuse (Fig.1).
X-ray analysis revealed that the ST10 and ST20
films contained a single crystalline phase. The decomposition of the profile of
each reflection by program PROFITVZ evidenced that only one rutile phase gave
the contribution to the intensity profile. Maximums in the mixed films patterns
are very weak and diffuse (Fig.1).
 |
| Fig.1. The results of the decomposition of (110) reflection to possible multicomponents. a, b and c present the decomposition of (110) reflection for SnO2, ST10 and ST20 electrodes, respectively, and show doublet (a1 and a2 ) for only one rutile phase. |
![]() That effect may point to the dispersion of
crystallites or/and to the microdistortions (disordered crystal structure), as
well as to the presence of amorphous phase. The crystallinity of SnO2 electrode
is much higher. The increase of reflection FWHM with the 2q (Bragg angle)
proportional to tg q [16] testifies to the existing of microdistortion in
ST10 and ST20 electrodes. This may be connected with disordered structure of mixed
phase containing SnO2 and TiO2. This fact does not allow
to do the correct estimation of crystal size from XRD data. The FWHM of SnO2
film (amounted 0.854) practically does not change with 2q that points to
the effect of crystallites dispersion as the main contribution in the width of
lines. In the latter case the average size of crystallites about 11 nm was
calculated by means of Sherrer formula [16].
That effect may point to the dispersion of
crystallites or/and to the microdistortions (disordered crystal structure), as
well as to the presence of amorphous phase. The crystallinity of SnO2 electrode
is much higher. The increase of reflection FWHM with the 2q (Bragg angle)
proportional to tg q [16] testifies to the existing of microdistortion in
ST10 and ST20 electrodes. This may be connected with disordered structure of mixed
phase containing SnO2 and TiO2. This fact does not allow
to do the correct estimation of crystal size from XRD data. The FWHM of SnO2
film (amounted 0.854) practically does not change with 2q that points to
the effect of crystallites dispersion as the main contribution in the width of
lines. In the latter case the average size of crystallites about 11 nm was
calculated by means of Sherrer formula [16].
![]() The integral intensities of (110) reflections were
148, 80 and 80 relative units for the films with x = 0, 10 and 20, respectively. However, the heating of plain SnO2
film up to 450 oC resulted in the increase of line intensity of main
strong lines (~ 20% for (110), and 40% for (101) and (301), that is the degree
of crystallinity increased. All these data permit us to estimate that the
content of amorphous phase in mixed films is higher than 50%.
The integral intensities of (110) reflections were
148, 80 and 80 relative units for the films with x = 0, 10 and 20, respectively. However, the heating of plain SnO2
film up to 450 oC resulted in the increase of line intensity of main
strong lines (~ 20% for (110), and 40% for (101) and (301), that is the degree
of crystallinity increased. All these data permit us to estimate that the
content of amorphous phase in mixed films is higher than 50%.
![]() The rutile cell parameters a and c for all three
samples are given below in Table 1. The remarkable decrease of a and c in titania-containing films in comparison with undoped one means that
some type of solid solution has been formed. The decrease of rutile lattice
periods from the values typical for tin oxide my be explained by the lower ion
radius of Ti4+ Ý(0.064 nm) in
comparison to the radius of Sn4+ (0.071 nm)
The rutile cell parameters a and c for all three
samples are given below in Table 1. The remarkable decrease of a and c in titania-containing films in comparison with undoped one means that
some type of solid solution has been formed. The decrease of rutile lattice
periods from the values typical for tin oxide my be explained by the lower ion
radius of Ti4+ Ý(0.064 nm) in
comparison to the radius of Sn4+ (0.071 nm)
![]() Refinement of film morphology and
determination of Sn atoms oxidation state and their local surrounding have been
solved by using of 119Sn MS. The analysis of Mössbauer spectra (the main characteristics of
the MS such as chemical shift (d), quadrupole splitting (E), and relative intensity, A
(area of spectra) are given in Table 1) leads to the following conclusions.
Refinement of film morphology and
determination of Sn atoms oxidation state and their local surrounding have been
solved by using of 119Sn MS. The analysis of Mössbauer spectra (the main characteristics of
the MS such as chemical shift (d), quadrupole splitting (E), and relative intensity, A
(area of spectra) are given in Table 1) leads to the following conclusions.
![]() 1. According to the magnitude of relative
absorption (~60%), the spectrum of the SnO2 film (Fig. 2)
corresponds to a solid sample with a high degree of crystallinity, while the
spectra of the films with x = 10 and
20 can be attributed to solids with a high degree of amorphous SnO2 due
to remarkably lower relative absorption.
1. According to the magnitude of relative
absorption (~60%), the spectrum of the SnO2 film (Fig. 2)
corresponds to a solid sample with a high degree of crystallinity, while the
spectra of the films with x = 10 and
20 can be attributed to solids with a high degree of amorphous SnO2 due
to remarkably lower relative absorption.
 |
| Fig.2. Mössbauer spectra of SnO2ñTiO2 films. a ñ SnO2, b ñ ST10 |
![]() 2. A doublet typical of the Sn atoms
in SnO2 represents the main contribution in all three films (93% ñ
98%); some increase in the chemical shift, d, in the spectra of mixed films in comparison
to SnO2 film may be associated with a small lengthening of the Sn ñ
O bonds in amorphous SnO2 due to the change in the s ñ p bonding.
2. A doublet typical of the Sn atoms
in SnO2 represents the main contribution in all three films (93% ñ
98%); some increase in the chemical shift, d, in the spectra of mixed films in comparison
to SnO2 film may be associated with a small lengthening of the Sn ñ
O bonds in amorphous SnO2 due to the change in the s ñ p bonding.
![]() 3. The distinctly remarkable second
doublet observed for all spectra is attributed to the partly hydrated SnO localized
at the surface. Detailed studies by XPS and inverse photoemission spectra [18, 19] demonstrated
that these "SnO" states are present on the disordered surface of SnO2
or in nanosized SnO2 crystallites. Disorder of SnO2
results in the loss of the symmetry centre of the Sn4+ cation
octahedral surrounding, in splitting of Sn5s and Sn5p atomic orbitals and emerging
of hybrid 5s ñ 5p orbitals, which are displayed as Sn2+ states. So
"SnO" surface states are indicative of tin atoms in SnO2 disordered
grain boundaries. The non monotonous dependence of Sn2+ content on titania
content will be discussed below.
3. The distinctly remarkable second
doublet observed for all spectra is attributed to the partly hydrated SnO localized
at the surface. Detailed studies by XPS and inverse photoemission spectra [18, 19] demonstrated
that these "SnO" states are present on the disordered surface of SnO2
or in nanosized SnO2 crystallites. Disorder of SnO2
results in the loss of the symmetry centre of the Sn4+ cation
octahedral surrounding, in splitting of Sn5s and Sn5p atomic orbitals and emerging
of hybrid 5s ñ 5p orbitals, which are displayed as Sn2+ states. So
"SnO" surface states are indicative of tin atoms in SnO2 disordered
grain boundaries. The non monotonous dependence of Sn2+ content on titania
content will be discussed below.
![]() Analysing together the XRD and MS
results one can notice two contradictory phenomena: in spite of the remarkable
change of rutile cell periods in the films studied, only a small increase in
chemical shift (d) with TiO2 content is
observed.
Analysing together the XRD and MS
results one can notice two contradictory phenomena: in spite of the remarkable
change of rutile cell periods in the films studied, only a small increase in
chemical shift (d) with TiO2 content is
observed.
![]() This
contradiction is removed if to take in consideration that the amorphous SnO2
dominates in mixed films while the crystalline rutile phase presents in less
quantity, as evidenced by XRD. In such case the amorphous SnO2 gives
higher contribution into Mössbauer parameters of mixed films
than tin oxide involved into rutile solid solution. The higher degree of
amorphous state in mixed films compared to SnO2 film results in the
small lengthening of the SnñO bonds. However that effect is not
related to crystalline SnO2 in solid solutions, that is the
influence of titanium oxide on electronic parameters of crystalline SnO2
was not revealed.
This
contradiction is removed if to take in consideration that the amorphous SnO2
dominates in mixed films while the crystalline rutile phase presents in less
quantity, as evidenced by XRD. In such case the amorphous SnO2 gives
higher contribution into Mössbauer parameters of mixed films
than tin oxide involved into rutile solid solution. The higher degree of
amorphous state in mixed films compared to SnO2 film results in the
small lengthening of the SnñO bonds. However that effect is not
related to crystalline SnO2 in solid solutions, that is the
influence of titanium oxide on electronic parameters of crystalline SnO2
was not revealed.
![]() The electrochemical behavior of the
films under study was similar to previously observed for titania-doped tin
oxide films described in [8, 9]. Galvanostatic charge-discharge curves (first
cycle) of the samples with various titania content demonstrate no pronounced
difference of capacities, whereas the irreversible capacity is noticeably
higher for ST20 sample (Fig. 3). For pure tin oxide (curve 1, Fig. 3) a plateau
at ca. 1 V is observed, which corresponds to reduction with formation of tin
metal; parallel formation of lower valency oxides also can not be excluded at
this potential region [8]. For titania-containing films, similar reduction
process takes place in a wider potential region and does not demonstrate any
special electrochemical features. This behavior can be explained by both
kinetic reasons and more pronounced heterogeneity of doped samples. The role of
dispersion can not be clarified at this stage.
The electrochemical behavior of the
films under study was similar to previously observed for titania-doped tin
oxide films described in [8, 9]. Galvanostatic charge-discharge curves (first
cycle) of the samples with various titania content demonstrate no pronounced
difference of capacities, whereas the irreversible capacity is noticeably
higher for ST20 sample (Fig. 3). For pure tin oxide (curve 1, Fig. 3) a plateau
at ca. 1 V is observed, which corresponds to reduction with formation of tin
metal; parallel formation of lower valency oxides also can not be excluded at
this potential region [8]. For titania-containing films, similar reduction
process takes place in a wider potential region and does not demonstrate any
special electrochemical features. This behavior can be explained by both
kinetic reasons and more pronounced heterogeneity of doped samples. The role of
dispersion can not be clarified at this stage.
 |
| Fig.3. Charging curves of tin dioxide films (first cycle) measured in 1M LiN(CF3SO2)2 in dioxolane. 1 ñ SnO2, 2 ñ ST10, 3 ñ ST20. Current density 80 mA g-1. |
![]() Despite of close reversible
capacities observed for the first cycle, the decrease of capacity in the course
of subsequent cycling depends on titania content (Fig. 4). We are concentrated
below on the understanding of micro(nano)structural doping effects which induce
so essential difference of degradation behavior.
Despite of close reversible
capacities observed for the first cycle, the decrease of capacity in the course
of subsequent cycling depends on titania content (Fig. 4). We are concentrated
below on the understanding of micro(nano)structural doping effects which induce
so essential difference of degradation behavior.
 |
| Fig.4. Cyclic stability of the reversible capacitance. 1 ñ SnO2, 2 ñ ST10, 3 ñ ST20. Current density 80 mA g-1. |
![]() Figs. 5b-d present typical STM
images of the films in mikrometer scale. Image of titanium support in Fig. 5a
is given for comparison. It is easy to observe deep scratches formed in the
course of mechanical polishing. Fast oxidation of titanium surface induced by
the tip is accompanied by formation of loose poorly conducting oxide. Films
under study demonstrate another type of topography, consisting of smooth
globules of 200ñ700 nm size. Globules consist of smaller nanoparticles, which
size decreases sharply with the increase of titania content (Fig. 6). Crystal
size estimated from STM data for SnO2 film with taking into account
image distortions induced by tip non-ideality [17]) are found to be in
agreement with the sizes estimated from XRD data (Table 1). These data
indicate the higher dispersion of titania-doped films. The clearness of STM images
decreases in the sequence ST0-ST10-ST20, as it can be seen in Fig. 6. Loss of
clearness can result from the increase of the content of amorphous phase.
Figs. 5b-d present typical STM
images of the films in mikrometer scale. Image of titanium support in Fig. 5a
is given for comparison. It is easy to observe deep scratches formed in the
course of mechanical polishing. Fast oxidation of titanium surface induced by
the tip is accompanied by formation of loose poorly conducting oxide. Films
under study demonstrate another type of topography, consisting of smooth
globules of 200ñ700 nm size. Globules consist of smaller nanoparticles, which
size decreases sharply with the increase of titania content (Fig. 6). Crystal
size estimated from STM data for SnO2 film with taking into account
image distortions induced by tip non-ideality [17]) are found to be in
agreement with the sizes estimated from XRD data (Table 1). These data
indicate the higher dispersion of titania-doped films. The clearness of STM images
decreases in the sequence ST0-ST10-ST20, as it can be seen in Fig. 6. Loss of
clearness can result from the increase of the content of amorphous phase.
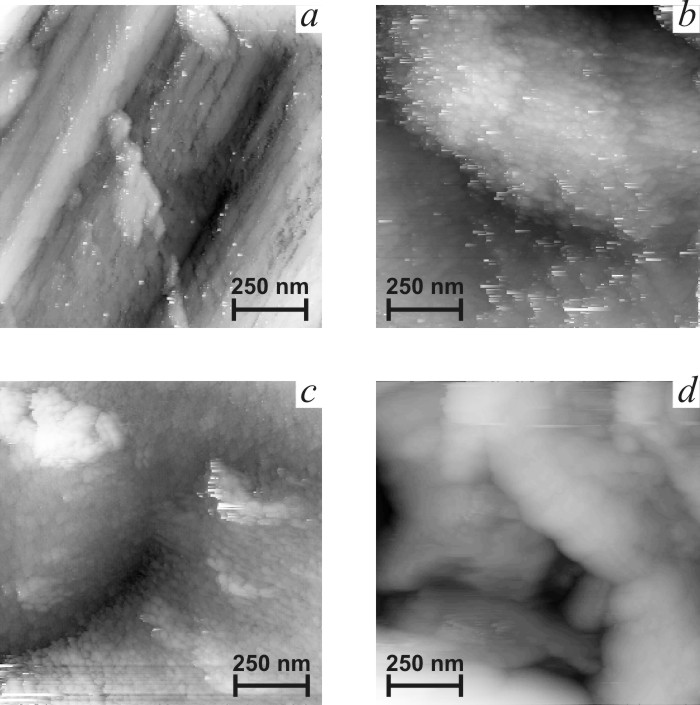 |
| Fig.5. Micrometer scale STM images of titanium support (a) and tin oxide films. b ñ SnO2, c ñ ST10, d ñ ST20. |
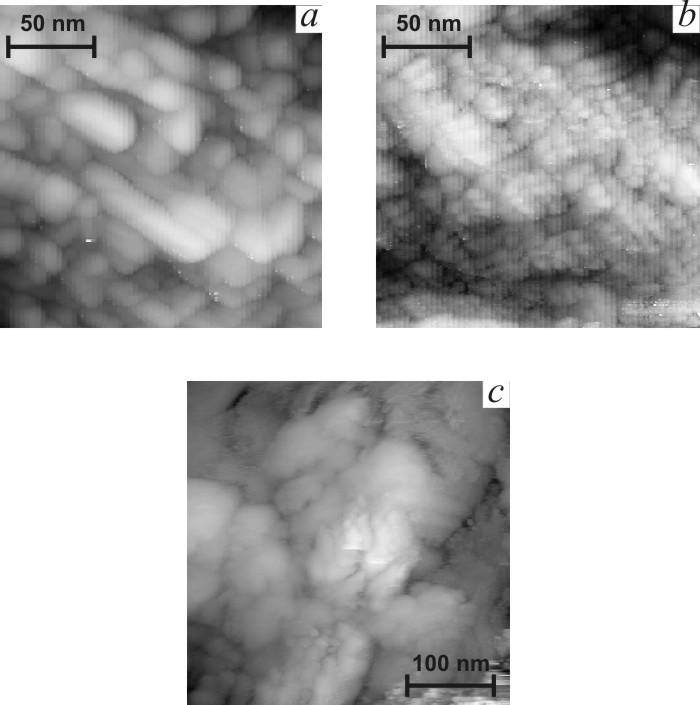 |
| Fig.6. Nanometer scale STM images of tin oxide films. a ñ SnO2, b ñ ST10, c ñ ST20. |
![]() Tunneling spectra (Fig. 7)
demonstrate the decrease of films conductivity with titania content, and also
more pronounced resistive heterogeneity for higher doping level. Low conductivity
of ST20 films makes it difficult to fix an STM tip and decreases the quality of
STM images of these films. One-two order increase of the resistance of STM gap
at positive currents (i.e. for the highest contributions of film resistance) is
found.
Tunneling spectra (Fig. 7)
demonstrate the decrease of films conductivity with titania content, and also
more pronounced resistive heterogeneity for higher doping level. Low conductivity
of ST20 films makes it difficult to fix an STM tip and decreases the quality of
STM images of these films. One-two order increase of the resistance of STM gap
at positive currents (i.e. for the highest contributions of film resistance) is
found.
 |
| Fig.7. Local voltage-current spectra obtained for tin dioxide films. 1 ñ SnO2, 2 ñ ST10, 3,4 ñ ST20. (curves typical for various points of heterogeneous sample). |
![]() Separation of air gap and film
resistance contributions to the total STM gap resistance presents a special
problem. With increase of film resistance, the effect of film on the slope of
voltage-current spectra rises sharply. The reason is as follows: at a certain
fixed base values of bias and current under equilibrium conditions the
resistance of air gap for more resistive films should be much lower, in order
to compensate the increased contribution of the film. Correspondingly, we can
conclude several-order increase of the specific resistance of the films with
titania content. Direct conductivity measurements are complicated by low film
thickness and the existence of more conducting support.
Separation of air gap and film
resistance contributions to the total STM gap resistance presents a special
problem. With increase of film resistance, the effect of film on the slope of
voltage-current spectra rises sharply. The reason is as follows: at a certain
fixed base values of bias and current under equilibrium conditions the
resistance of air gap for more resistive films should be much lower, in order
to compensate the increased contribution of the film. Correspondingly, we can
conclude several-order increase of the specific resistance of the films with
titania content. Direct conductivity measurements are complicated by low film
thickness and the existence of more conducting support.
![]() Qualitatively, the observed
resistance vs. composition dependence agrees well with previous data of direct
conductivity measurements of similar films on insulating supports [2].
Qualitatively, the observed
resistance vs. composition dependence agrees well with previous data of direct
conductivity measurements of similar films on insulating supports [2].
![]() Increased heterogeneity of local
conductivity observed for the films with higher titania content can be referred
to more pronounced heterogeneity of chemical/phase composition. For ST20,
heterogeneity results in one order difference of the slopes of voltage-current
spectra measured in various points (curves 3 and 4 in Fig. 7). For less doped
films, difference in local conductivity of various areas is clearly seen in
more sensitive voltage-distance spectra (Fig. 8). For certain points these
spectra are smooth, with the changes of distance below 5 nm (curve 1 in Fig. 8).
Curves of this type correspond to more conductive areas. The spectra of similar
shape with close distance values were obtained also for pure tin dioxide. For
some other areas (which topographic images usually look more cloudy)
voltage-distance spectra are asymmetric and include stepwise features with
distance changes of 50 ñ 100 nm (curve 3 in Fig. 8). We associate this sharp distance
increase with the fact that at low voltages the film conductivity is too low
for passing the established current. Under constant current mode this situation
results in closer approaching of tip and appearance of direct tip-sample
contact, with partial penetration of tip into the film. In the framework of
this hypothesis the appearance of stepwise features manifests much higher local
resistance of the areas under study.
Increased heterogeneity of local
conductivity observed for the films with higher titania content can be referred
to more pronounced heterogeneity of chemical/phase composition. For ST20,
heterogeneity results in one order difference of the slopes of voltage-current
spectra measured in various points (curves 3 and 4 in Fig. 7). For less doped
films, difference in local conductivity of various areas is clearly seen in
more sensitive voltage-distance spectra (Fig. 8). For certain points these
spectra are smooth, with the changes of distance below 5 nm (curve 1 in Fig. 8).
Curves of this type correspond to more conductive areas. The spectra of similar
shape with close distance values were obtained also for pure tin dioxide. For
some other areas (which topographic images usually look more cloudy)
voltage-distance spectra are asymmetric and include stepwise features with
distance changes of 50 ñ 100 nm (curve 3 in Fig. 8). We associate this sharp distance
increase with the fact that at low voltages the film conductivity is too low
for passing the established current. Under constant current mode this situation
results in closer approaching of tip and appearance of direct tip-sample
contact, with partial penetration of tip into the film. In the framework of
this hypothesis the appearance of stepwise features manifests much higher local
resistance of the areas under study.
 |
| Fig.8. Local voltage-distance spectra of ST10 sample: representative types of curves observed at various points of the sample. |
![]() There are a lot of surface areas for
which an intermediate type of voltage-distance spectral behavior is observed
(curve 2 In Fig. 8), and correspondingly intermediate values of conductivity
can be concluded for these areas.
There are a lot of surface areas for
which an intermediate type of voltage-distance spectral behavior is observed
(curve 2 In Fig. 8), and correspondingly intermediate values of conductivity
can be concluded for these areas.
![]() For ST20 samples, the stepwise
behavior of voltage-distance spectra is observed for any point of the surface.
Typical distances appear to be up to 1 mm, which value exceeds the vertical resolution
of the STM device. This observation obtained with the most resistive samples confirms
the interpretation of voltage-distance anomalous behavior discussed above.
For ST20 samples, the stepwise
behavior of voltage-distance spectra is observed for any point of the surface.
Typical distances appear to be up to 1 mm, which value exceeds the vertical resolution
of the STM device. This observation obtained with the most resistive samples confirms
the interpretation of voltage-distance anomalous behavior discussed above.
![]() The pronounced increase of the total
film resistance can result from the changes in conductivity of the crystalline
solid solution SnO2-TiO2, and also from the increase of
contribution of the poorly conducting amorphous component (both effects are
assumed to be size-dependent). The specific features of fixing the tip in the
gap can be the reason of the change of image nature: the increase of total
resistance can lead from the imaging of conductive crystalline component to the
imaging of amorphous component and (or) simultaneous imaging of both components.
The appearance of steps in the voltage-distance spectra agrees with the
assumption about the abovementioned change. The qualitative difference of ST20
STM images as compared to less doped films also supports this assumption.
However we can not determine the quantity of amorphous component from STM data.
The pronounced increase of the total
film resistance can result from the changes in conductivity of the crystalline
solid solution SnO2-TiO2, and also from the increase of
contribution of the poorly conducting amorphous component (both effects are
assumed to be size-dependent). The specific features of fixing the tip in the
gap can be the reason of the change of image nature: the increase of total
resistance can lead from the imaging of conductive crystalline component to the
imaging of amorphous component and (or) simultaneous imaging of both components.
The appearance of steps in the voltage-distance spectra agrees with the
assumption about the abovementioned change. The qualitative difference of ST20
STM images as compared to less doped films also supports this assumption.
However we can not determine the quantity of amorphous component from STM data.
![]() Based on STM,
XRD and MS results we could propose the following model of nanostructured doped
films.
Based on STM,
XRD and MS results we could propose the following model of nanostructured doped
films.
![]() The highly dispersed
(on STM base) rutile phase observed in mixed films studied in the present work
may be classified as a solid solution with short range order or as a
nanocomposite containing both SnO2 and TiO2 nanoclusters
(<1 nm in size). Poorly ordered tin and titanium oxide nanoclusters are
randomly distributed in partially hydrated amorphous tin oxide matrix. The
latter are pierced by ultra fine pores which contain H2O molecules
and Cl- ions. The crystalline SnCl2 intercalation phase
has been found to be the precursor of that nanostuctured forms [2, 11]. The
quantities of that rutile phase in both mixed films are approximately equal, as
limited by the content of Sn(II) anionic chloro complexes in origin solution of
tin and titanium chlorides. The concentration of these complexes is constant because
of constant cHCl.
The highly dispersed
(on STM base) rutile phase observed in mixed films studied in the present work
may be classified as a solid solution with short range order or as a
nanocomposite containing both SnO2 and TiO2 nanoclusters
(<1 nm in size). Poorly ordered tin and titanium oxide nanoclusters are
randomly distributed in partially hydrated amorphous tin oxide matrix. The
latter are pierced by ultra fine pores which contain H2O molecules
and Cl- ions. The crystalline SnCl2 intercalation phase
has been found to be the precursor of that nanostuctured forms [2, 11]. The
quantities of that rutile phase in both mixed films are approximately equal, as
limited by the content of Sn(II) anionic chloro complexes in origin solution of
tin and titanium chlorides. The concentration of these complexes is constant because
of constant cHCl.
![]() As concerned
to the amorphous phase, tunneling spectroscopy evidences the remarkable
increase of the resistance with TiO2 content. For ST20 electrode
such increase occurs for any point of the surface (both for globules with
crystalline coreÝ and completely
amorphous globules). The high resistance is typical for the surface of the
nanoparticles composing of tinñtitanium oxide solid solution [1, 2]. The high
resistance of completely amorphous globules means that amorphous SnO2
phase of the electrodes is also essentially enriched with TiO2.
As concerned
to the amorphous phase, tunneling spectroscopy evidences the remarkable
increase of the resistance with TiO2 content. For ST20 electrode
such increase occurs for any point of the surface (both for globules with
crystalline coreÝ and completely
amorphous globules). The high resistance is typical for the surface of the
nanoparticles composing of tinñtitanium oxide solid solution [1, 2]. The high
resistance of completely amorphous globules means that amorphous SnO2
phase of the electrodes is also essentially enriched with TiO2.
![]() The
remarkable increase of the amorphous mixed phase may result from the higher
number of Ti (IV)
hydroxooxo complexes
and higher degree of their polymerisation in initial solution with
concentration of TiCl4
of 1 mol/l. These polymeric species, which in essence appear the nuclea of
hydrated titanium oxide, favor the hydrolysis of SnCl2. The latter
process induces the formation of mixed hydrated tin and titanium oxides, which
remain in amorphous state up to 450 oC.
The
remarkable increase of the amorphous mixed phase may result from the higher
number of Ti (IV)
hydroxooxo complexes
and higher degree of their polymerisation in initial solution with
concentration of TiCl4
of 1 mol/l. These polymeric species, which in essence appear the nuclea of
hydrated titanium oxide, favor the hydrolysis of SnCl2. The latter
process induces the formation of mixed hydrated tin and titanium oxides, which
remain in amorphous state up to 450 oC.
![]() In
conclusion, the existance of two types of precursors of the main components in
mixed films was the reason of the different content of Sn2+ as observed my MS. The increase
of SnO in the ST10 film in comparison to SnO2 film may be explained
by both the dispersion of nanoparticles observed by STM and by the role of
precursor of the rutile solid solution (crystalline SnCl2
intercalation phase). In the course of decomposition of the latter the
amorphous SnO2 layers containing up to 15% SnO cover the globule
surface [2]. The increase of Ti component results in the higher content of
tin(IV) and titanium hydrated forms [11]. Therefore we can atribute the
decrease of SnO content in the film x=20
with the latter effect.
In
conclusion, the existance of two types of precursors of the main components in
mixed films was the reason of the different content of Sn2+ as observed my MS. The increase
of SnO in the ST10 film in comparison to SnO2 film may be explained
by both the dispersion of nanoparticles observed by STM and by the role of
precursor of the rutile solid solution (crystalline SnCl2
intercalation phase). In the course of decomposition of the latter the
amorphous SnO2 layers containing up to 15% SnO cover the globule
surface [2]. The increase of Ti component results in the higher content of
tin(IV) and titanium hydrated forms [11]. Therefore we can atribute the
decrease of SnO content in the film x=20
with the latter effect.
![]() Doping of SnO2
with TiO2 results in pronounced dispersion of the solid. This effect
is induced by 2-2.5 times decrease of nanoparticles forming the films, and also
by oxide dispersion in the shorter scale. Nanoparticles consist of disordered
nanostructured solid solutions (presented by SnO2 and TiO2
nanoclusters of nanometer-scale size) and amorphous phase formed by both SnO2
and TiO2. The portion of amorphous phase in the films under study is
essentially higher than in electrode materials studied in our previous works
[1, 2], and its reason is the change of hydrolysis conditions for initial
solutions of salt reagents. Just this extremely high dispersity of titana,
which is a component stable to reduction with lithium, can be considered as a
reason of better degradation stability with simultaneous keeping high capacity
values (typical for nanostructured tin oxides). Direct observation of the
increase of tin dioxide dispersion with doping titania content is obtained.
Doping of SnO2
with TiO2 results in pronounced dispersion of the solid. This effect
is induced by 2-2.5 times decrease of nanoparticles forming the films, and also
by oxide dispersion in the shorter scale. Nanoparticles consist of disordered
nanostructured solid solutions (presented by SnO2 and TiO2
nanoclusters of nanometer-scale size) and amorphous phase formed by both SnO2
and TiO2. The portion of amorphous phase in the films under study is
essentially higher than in electrode materials studied in our previous works
[1, 2], and its reason is the change of hydrolysis conditions for initial
solutions of salt reagents. Just this extremely high dispersity of titana,
which is a component stable to reduction with lithium, can be considered as a
reason of better degradation stability with simultaneous keeping high capacity
values (typical for nanostructured tin oxides). Direct observation of the
increase of tin dioxide dispersion with doping titania content is obtained.
![]() Nanoheterogeneous character of
rutile phase observed for the films under study is confirmed by XRD and
Mössbauer spectroscopy investigations.
Nanoheterogeneous character of
rutile phase observed for the films under study is confirmed by XRD and
Mössbauer spectroscopy investigations.
![]() The decrease of particle size is
assumed to be a reason of more slow degradation in the course of cycling in
lithium-containing solutions (Fig. 3). Actually, the enlargement of metallic
tin particles should be very slow when these particles are separated by low
conductive (and most probably amorphous) oxide with high titania content.
Heterogeneity of doped films confirmed by local tunneling spectroscopy can be
considered as a possible reason of the absence of plateau. Both heterogeneity
of ohmic drop and equilibrium potentials for certain redox transformations of
chemically different areas can be assumed, and these two effects can hardly be
separated at this stage.
The decrease of particle size is
assumed to be a reason of more slow degradation in the course of cycling in
lithium-containing solutions (Fig. 3). Actually, the enlargement of metallic
tin particles should be very slow when these particles are separated by low
conductive (and most probably amorphous) oxide with high titania content.
Heterogeneity of doped films confirmed by local tunneling spectroscopy can be
considered as a possible reason of the absence of plateau. Both heterogeneity
of ohmic drop and equilibrium potentials for certain redox transformations of
chemically different areas can be assumed, and these two effects can hardly be
separated at this stage.
![]() Interpretation of electrochemical
data for highly resistive films is complicated by the uncertainty of potential
values, which are distorted by the ohmic drop and possible heterogeneity of
potential distribution along the surface. Under these circumstances one can not
exclude the selective solvent discharge at already formed metallic fragments,
which gives additional contribution to the total charge.
Interpretation of electrochemical
data for highly resistive films is complicated by the uncertainty of potential
values, which are distorted by the ohmic drop and possible heterogeneity of
potential distribution along the surface. Under these circumstances one can not
exclude the selective solvent discharge at already formed metallic fragments,
which gives additional contribution to the total charge.
![]() The authors are grateful to
A.V.Denisov for technical support of STM and spectroscopic studies. The study
is supported by RFBR, projects 03-03-32422-a, 02-03-32226-a.
The authors are grateful to
A.V.Denisov for technical support of STM and spectroscopic studies. The study
is supported by RFBR, projects 03-03-32422-a, 02-03-32226-a.
Table 1. XRD and Mössbauer spectra data for SnO2 ñ TiO2 films.
| Electrodes STx | Rutile cell periods, nm | Dav, nm* | Mössbauer spectra data | |||
| Tin oxide doublet | d, mm/s vs. CaSnO3 | DE,mm/s | A,% | |||
| SnO2(x = 0) | a= 0.4734 c= 0.3175 |
11.0 ± 1.0 | SnO2 | ñ0.0076±0.0016 | 0.532±0.004 | 98.34 |
| SnO | 2.83±0.12 | 1.91±0.12 | 1.72 | |||
| ST10 (x = 10%) | a= 0.4705 c= 0.3165 |
SnO2 | 0.0122±0.0038 | 0.511±0.010 | 93.45 | |
| SnO | 2.951±0.072 | 1.82±0.13 | 6.55 | |||
| ST20 (x = 20%) | a= 0.4670 c= 0.3118 |
SnO2 | 0.0176±0.0043 | 0.516±0.012 | 98.05 | |
| SnO | 2.85±0.12 | 2.08±0.24 | 1.95 | |||
* Dav Ýó the average size of crystallites determined
with the use of FWHM for (110) reflection by Sherrer method. (![]() ,
, ![]() Ýnm [16])
Ýnm [16])